Today was Day 11 of the growth assay and the day I analyzed the results of the cytotoxicity assay. I am going to share the growth assay results in this post and the cytotoxicity results in next week’s post.
To recap, last week and this week I was comparing different percent serums on the growth of vascular smooth muscle cells. This is helpful to understand what conditions allow these cells to thrive. In other experiments, that involve drugs inhibiting the growth of the cells, it is important to grow the cells in a serum concentration that doesn’t stagnate growth in addition to the drugs. The lab uses 10% FBS media to run most experiments and as you can see by the graph this serum allows the cells to exponentially grow:

%RED is the y-axis and is simply the Alamarblue fluorescence of the living cells
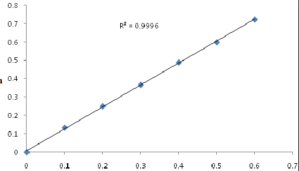
When I showed the results to my external advisor a few questions and suggestions came up. First, it is not possible for the cells to stop growing (Day 7-9 for 0.5% and 1%), regardless of the serum used. When looking at the data the cells did grow, the graph is an inaccurate representation of this. Second, my advisor suggested I manually count the cells today (Day 11) to make sure the Alamarblue reading is accurate. I did do this today and slowly became frustrated at how tedious this process is. Personally, I don’t believe manually counting the cells is as accurate as the plate reader. Third, my advisor wants a clearer connection established between % reduction and the actual cell number. I plan to do this using the standard curve I established on Day 1.
A standard curve allows for absorbance values to indicate a rough cell number. You can trace this curve to determine the cell number for any absorbance value. Looks close to this graph:
Next week, I am restarting the proliferation assay with a new drug, Imatinib. This drug is known to treat cancer, but also has applications in vascular healing. I am going to test Imatinib’s effectiveness in inhibiting PDGF.
Platelet-derived growth factor (PDGF) is a mitogen (mitosis inducing) factor for vascular smooth muscle cells and plays an important role in neointimal formation and restenosis
Experiments in animals have shown that imatinib inhibits restenosis after a stent is  inserted. I am going to be using micro-molar
 concentrations of this drug on VSMCs and compare the results to the resolvin assay. I can’t wait to see how this assay’s results unfold!
The last two weeks I have shared risk factors (high blood pressure and smoking) that are controllable or treatable. Unfortunately, there are circumstances beyond our control and risk factors that can not be changed.
This week’s risk factors: Heredity and Race
Coronary Artery/Heart Disease is a heredity disorder. Children whose parents had CAD
are more likely to develop blockage in their heart’s arteries. There is also a correlation between race and CAD. African Americans tend have higher blood pressure than Caucasians. Mexican Americans, American Indians, native Hawaiians and Asian Americans have a higher risk of heart disease.
If you want to learn more about these risk factors or see whether you were born with any other untreatable risk factors: Risk Factors We Can’t Avoid
Not being able to control race and family history makes controlling other risk factors even more important! 
Thank you for reading 🙂

Pingback: Week 8 – Much More to Come | The Effectiveness of Drug-Eluting Stents
Pingback: Week 9/10 – Scratching the Surface (literally and figuratively) | The Effectiveness of Drug-Eluting Stents